Understanding Heap Memory in Java Applications

Let us begin with a pretty simple question. Does every Java Developer understand how memory works in Java? One goal of a Java Developer is to make sure their application has some of the best performance it can get from fine-tuning their Java software applications. Java Memory Management takes some time to learn and understand for everyone who uses Java. The goal of this article is to help people understand how to gain these skills.
The whole idea is to allow the process of allocating new objects and removing unused objects – better known as Garbage Collection (GC) in the Java programming language – properly. By default, Java manages memory automatically pretty well. This is due to the garbage collector in the background to clean up unused or unreferenced objects to free up some percentage of memory.
Without the proper experience and knowledge of how the Java Virtual Machine (JVM), Garbage Collector, and how Java uses memory, a lot of the Java Developers will not find and fix the bottlenecks when we execute Java code and test for performance.
Do you like what you are reading? We do recommend this next article – Java 23: The New Features are Officially Announced – to you to continue learning with us.

Understanding how Java manages memory is vital for all Java Developers who are coding Java software applications. This tends to be a very technical task to take on for beginners all the way to the experts of Java development.
With my experience of programming, coding, learning how a programming language really works, researching into technical issues, and hosting a lot of Minecraft servers over the years, I started to finally understand how various runtimes work in the Java Virtual Machine. When I first started this adventure, I was not exactly sure how or where does an object in Java is created. I also didn't exactly understand how unreferenced objects are cleared by the different Garbage Collectors from different areas of the Java Heap memory.
When I first started out trying to optimize several Minecraft servers for way better performance, I managed to come across several memory errors such as java.lang.OutOfMemoryError. This is where I started to understand way more about what the role of the Heap and Stack meant in optimizing Java Memory.
One important lesson is to know is how Java memory management works. It is always going to start with the Java Virtual Machine then how to fine-tune the Java Virtual Machine for the best performance possible. Any class, method, object, or variable created is all about the memory. This means that everything gets stored in the JVM Heap Memory.
Java Heap Memory
I bet a lot of people have looked over at least 10 to 20 different diagrams that explain the design of Java Heap Memory. Every single Java Developer needs to understand the difference between PermGen and Metaspace from the latest releases of the Java Development Kit (JDK). We are able to refer to the diagrams right below.
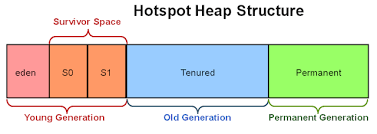
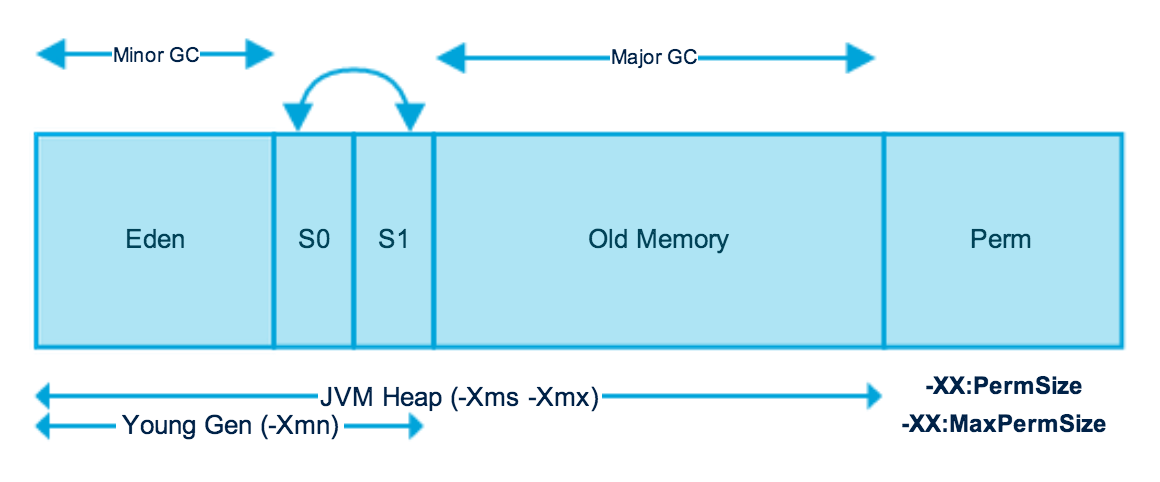
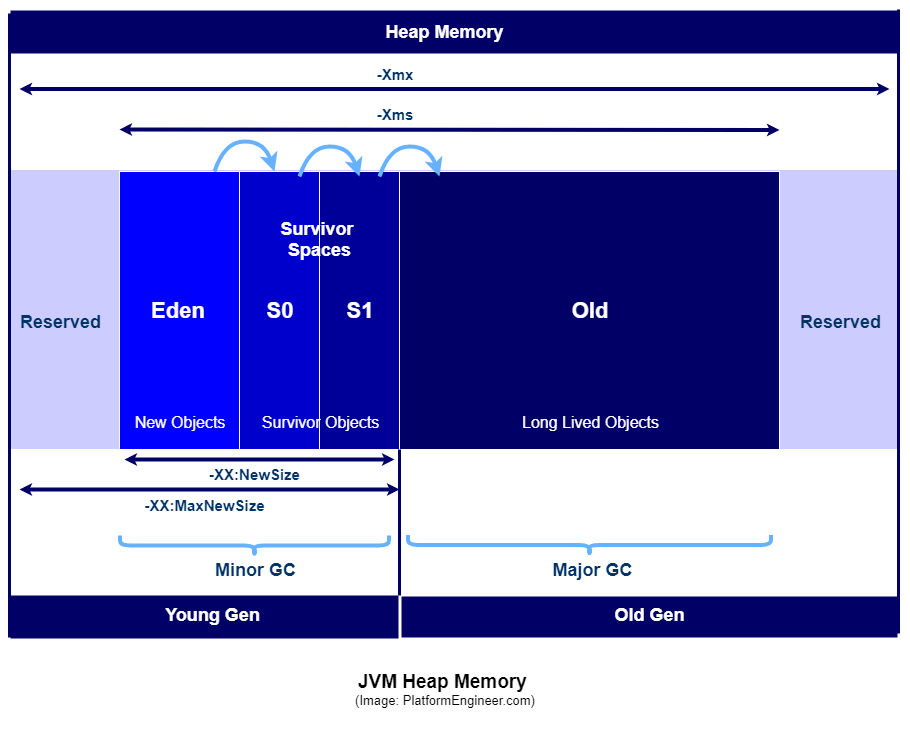
The Heap Memory is divided into two generations. The first is the young and the second is the old. The first major part is called the eden space while the second is called the survivor space. The survivor space consists of survivor0 and survivor1 spaces.
Now we can explain the purpose of each of the spaces in the young generation. Whenever we create new objects, all of the objects will be stored in the eden space at first. In the Java Virtual Machine, the automatic memory management will take over for you by default.
If or when the application has a lot of objects – creates thousands of them as an example – the eden memory will be completely filled with objects. Then when the Garbage Collectors notices this, it will then delete all of the unused or unreferenced objects. This process is known as the Minor Garbage Collector. Then the Minor Garbage Collector will move all of the survivor objects into the survivor memory space. The takeaway here is the Minor Garbage Collector will automatically be performed on the young generation to free up memory as needed. This will be performed fast for a short amount of time.
With there being so many objects that are created for different classes in the application code will cause the memory in the eden space to increase. At this point, we can assume that the GC1, GC2, and GC3, and however many more are all triggered. When there are many Garbage Collector operations are automatically called on by the Java Virtual Machine then the Minor Garbage Collector keeps checking all objects that are ready to be moved to survivor. Finally, the Java Virtual Machine is ready to shift all of the objects left over to the survivor memory.
The objects that are survived in young Generation are moved to the old generation and when the old generation is getting filled with objects the Major Garbage Collector (GC) is triggered.
Major Garbage Collector
When the old generation of memory is completely full with objects then the Major Garbage Collector is performed. Please note that it does take some time for the Major Garbage Collection to run. When a Java Developer or a Team of Java Developers create a Java application or uses an automation framework, they need to be extremely careful about young and old generation concepts.
One major thing a Java Developer needs to consider is to not create unnecessary objects that their application code does not use very often. Then if they create any objects, then the Garbage Collector should destroy them once they have completed their task(s) that were assigned. You can take away the following for simplicity of understanding the Garbage Collection.
The Minor Garbage Collector will target theyounggeneration, and theoldgeneration will be performed by the Major Garbage Collector.
As an example, if we took Amazon or Walmart's websites, there would be so many requests to the webserver. We will see high traffic then timeout requests. This would be due to the Major Garbage Collector taking up a large footprint of memory to destroy the unused objects. The side effect of this work is high CPU and RAM usage on the node(s) serving the website(s).
This indicates that they are internally creating so many objects of that particular class. In this example, the Major Garbage Collector will try to destroy all the unused objects continuously in high numbers. The Major Garbage Collector will take a way longer time as compared to Minor Garbage Collector.
Memory Related Errors
What I recommend for all Java Developers to understand is that the outputs can only give you an idea of what the Java Virtual Machine is experiencing – it's not the actual error in the application code that is going on. The actual cause of the error which you see is usually in the code such as a memory leak, garbage collection problem, resource allocation, or even a synchronization issue. For us to be able to solve this issue, the easy solution is to increase the the affected resource limit sizes.
Please note that we will need to monitor resource usage also. Performance testing your Java applications is highly recommended. This can range from profiling each category, take multiple heap dumps, check and debug application code, and more. If none of these fixes which is being recommended works, it is usually where your application needs more resources allocated to it. Here is some common errors and what they are about right below.
java.lang.StackOverFlowError— This error indicates that Stack memory is full.java.lang.OutOfMemoryError— This error indicates that Heap memory is full.java.lang.OutOfMemoryError: GC Overhead limit exceeded— This error indicates that GC has reached its overhead limitjava.lang.OutOfMemoryError: Permgen space— This error indicates that Permanent Generation space is fulljava.lang.OutOfMemoryError: Metaspace— This error indicates that Metaspace is full (since Java JDK 8)java.lang.OutOfMemoryError: Unable to create new native thread— This error indicates that JVM native code can no longer create a new native thread from the underlying operating system because so many threads have been already created and they consume all the available memory for the Java Virtual Machine.java.lang.OutOfMemoryError: request size bytes for reason— This error indicates that swap memory space is fully consumed by applicationjava.lang.OutOfMemoryError: Requested array size exceeds VM limit— This error indicates that our application uses an array size more than the allowed size for the underlying platform.
Setting the Initial and Maximum Heap
Initial Heap Size — XMS
This is the initial heap size. You want it to be about 1/64th of the total RAM on the node you are using. The usual value I have always set it as was 128MB by default. This can also be overridden via command line using the option java -Xms128M.
Maximum Heap Size — XMX
This is the maximum allowed memory. The smaller of the total RAM of the node you are using. The usual value I have always set it as was 8192MB by default. This can also be overridden via command line using the option java -Xmx8192M.
Here is a full example of a startup command for a java application.
java -Xms128M -Xmx8192M app.jarThe initial and maximum can be changed based on the needs of the application. These are the usual defaults I assign to all Java applications which I work with – I mainly work with Minecraft servers and people tend to want 8GB of memory max to their Minecraft server. I also give them an extra 1GB of memory due to background task(s) like Garbage Collection.
Additional Options
-XX:+UseG1GC: Enables the Garbage-First (G1) garbage collector, which is designed for applications with large heaps and limited Garbage Collection latency requirements.-XX:+UseZGC: Enables the Z Garbage Collector, which is designed for applications requiring low latency without sacrificing throughput.-XX:+UseShenandoahGC: Enables the Shenandoah Garbage Collector, which aims to reduce Garbage Collection pause times by performing more garbage collection work concurrently with the application threads.-XX:+UseParallelGC: Enables the parallel garbage collector for theyounggeneration.-XX:NewRatio=<ratio>: Sets the ratio between the young and old generation sizes. For example,-XX:NewRatio=3means the old generation will be three times the size of the young generation.-XX:SurvivorRatio=<ratio>: Sets the ratio of theeden/survivorspace size. Decreasing this ratio can increase the size of the survivor spaces.-XX:MaxGCPauseMillis: Sets a target for the maximum Garbage Collector pause time. This is a soft goal, and the Java Virtual Machine will make its best effort to achieve it.-XX:+UseSerialGC: Enables the serial garbage collector, which uses a single thread for garbage collection and is suitable for small applications with low memory footprint.-XX:ParallelGCThreads: Sets the number of threads used during parallel phases of the garbage collectors. The default value varies with the platform on which the Java Virtual Machine is running.-XX:ConcGCThreads: Number of threads concurrent garbage collectors will use. The default value varies with the platform on which the Java Virtual Machine is running.-XX:InitiatingHeapOccupancyPercent: Percentage of the entire heap occupancy to start a concurrent Garbage Collection cycle.-XX:+HeapDumpOnOutOfMemoryError: Tells the Java Virtual Machine to generate a heap dump when it throws anOutOfMemoryError.-XX:+PrintGCDetails: Prints detailed output at each garbage collection. Useful for tuning the garbage collector.-XX:+PrintGCDateStamps: Adds a date stamp to each garbage collection event printed in the logs.-XX:+PrintHeapAtGC: Prints detailed information about the heap before and after Garbage Collection.-XX:+PrintGCApplicationStoppedTime: Prints how much time was spent in Garbage Collection pauses, helping in identifying pause times due to Garbage Collection.-XX:+PrintGCApplicationConcurrentTime: Reports the time spent outside of garbage collection (i.e., the time the application was running).-XX:+UseCodeCacheFlushing: Allows the Java Virtual Machine to flush the code cache when it is full, which can help prevent the Java Virtual Machine from shutting down if the code cache fills up.
The Conclusion
There is easily over 500+ arguments that you can pass to Java Virtual Machine to fine-tune the Garbage Collection and Java application memory. If also are willing to include other aspects, the number of Java Virtual Machine arguments that will cross 1000+. We have explained only a very few arguments that are the most problematic when it comes to managing Java applications and software.
Do you like what you're reading from the CoderOasis Technology Blog? We recommend reading our Hacktivism: Social Justice by Data Leaks and Defacements as your next choice.

The CoderOasis Community
Did you know we have a Community Forums and Discord Server? which we invite everyone to join us? Want to discuss this article with other members of our community? Want to join a laid back place to chill and discuss topics like programming, cybersecurity, web development, and Linux? Consider joining us today!